Evaporative Emissions Diagnostics (19-7062)
Reference number: 19-7062
EVAPORATIVE EMISSIONS DIAGNOSTICS
GENERAL SERVICE BULLETIN
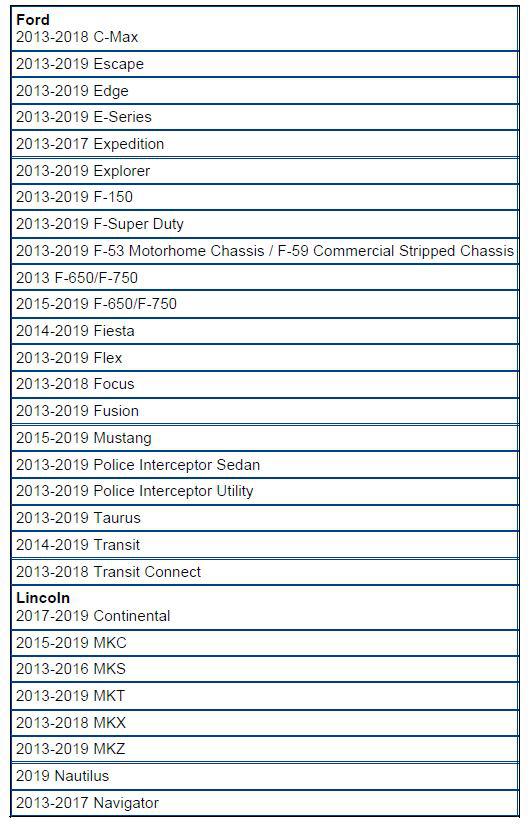
| FORD: | See list below |
| LINCOLN: | See list below |
MODEL
SUMMARY
This article is designed to provide Integrated Diagnostic System (IDS) evaporative emissions (EVAP) test result examples of functioning and non-functioning vapor blocking valves (VBV) on vehicles equipped with them.
SERVICE INFORMATION
A new IDS tool has been developed to assist in determining if the VBV is working correctly.
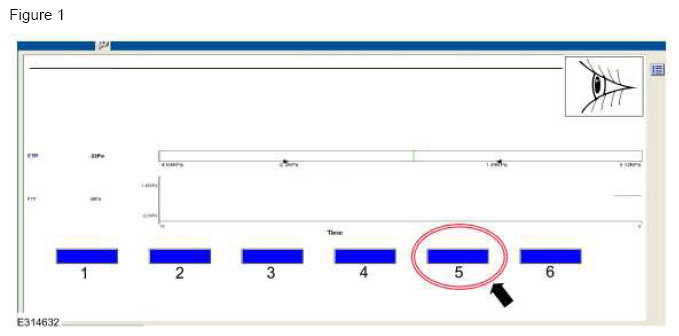
This tool is located in the EVAP test itself. Entering the EVAP tool, Powertrain > Fuel > EVAP. Click on the "EVAP Toolbox" option, not the "EVAP Test" option. Once in the EVAP toolbox, select the "VBV Check" option from the list of tools, as seen below, and follow the on screen instructions. It will be the 5th option from the left. (Figure 1 Callout 5)
| Item | Description |
|---|---|
| 1 | Target Vacuum |
| 2 | Bleed Up |
| 3 | EVAPCP Check |
| 4 | Vapor Gen. |
| 5 | VBV Check |
| 6 | Cancel |
To determine if the VBV is functional, follow the process below after the VBV check has run for at least 60 seconds.
Functioning Valve
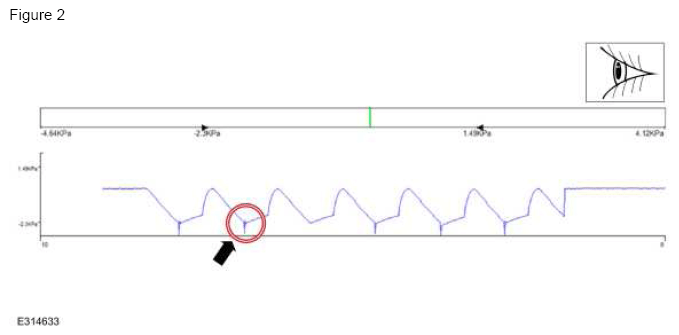
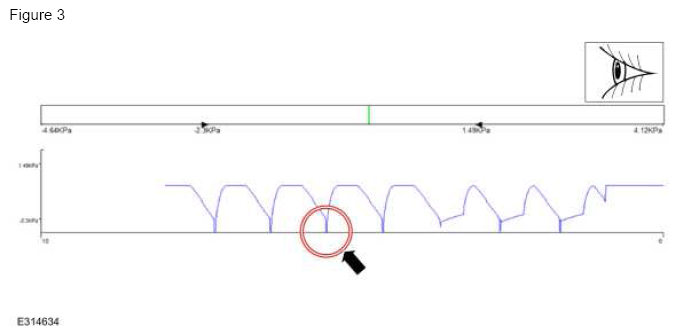
If the VBV on the vehicle is functional, the fuel tank pressure (FTP) graph will have a noticeable downward spike in pressure when the VBV is cycled open. The VBV is cycled open once the pressure in the EVAP system reaches a target vacuum level. Figures 2-3 both display FTP graphs of functional valves as indicated by the highlighted downward spike in tank pressure.
In Figure 2, the pressure did not spike downward in the third cycle. If at least 1 out of every 3 cycles observes a downward spike in pressure then the VBV is operating properly. Therefore, the absence of a downward spike during one cycle in Figure 2 can be ignored because 5 other cycles showed a downward pressure spike.
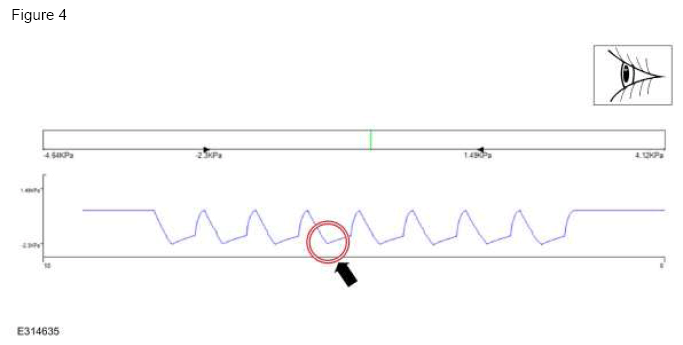
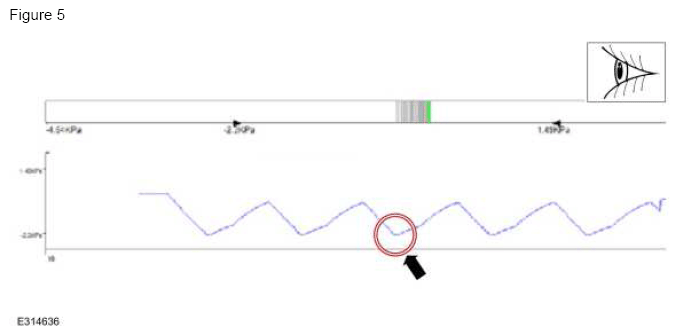
Non-functioning Valve
If the VBV is faulty then the FTP graphs will appear as they do in Figures 4-5. Once the target vacuum is reached, there is no sudden change in pressure when the VBV is cycled to open. The graph will reach a valley and slowly taper up as shown by the arrow in Figures 4-5.